TPE
Tree-structured Parzen Estimator
Both GP and TPE are optimization methods categorized as Bayesian optimization, and these will be introduced. The differences are outlined below.
- GP uses
p(y|x)to calculate EI(Expected Improvement).- Assume posterior distribution from observation points and use it to determine next search point.
- The time complexity is
O(n^3)since there is an inverse matrix calculation in the process of doing GP.
- TPE uses
p(x|y)andp(y)to calculate EI.- The posterior distribution of y, p(y|x), is not required.
- The time complexity of TPE is O(nlogn) because of the need to sort the values in relation to dividing y in two by the value of y∗ .
- Since each variable is assumed to be independent (not multivariate), the
overall time complexity is
O(dnlog(n))with the number of variables, d, entered above.
About TPE Algorithm
Since the above explanation may not be clear, this section describes the actual
TPE behavior.
Optimization by TPE is performed by repeatedly executing STEP2 to STEP3.
STEP1
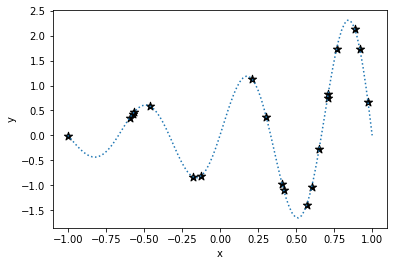
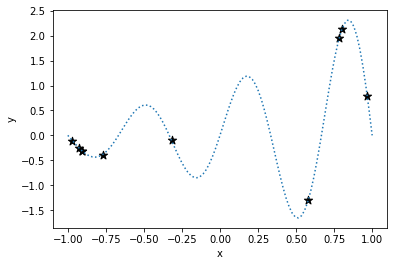
First, random sampling is performed. Here it is sampled as solving the following function minimization problem.
y = exp(x)*sin(3πx)
-1 < x < 1
The stars are sampling points.
STEP2
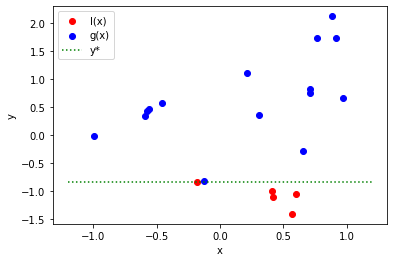
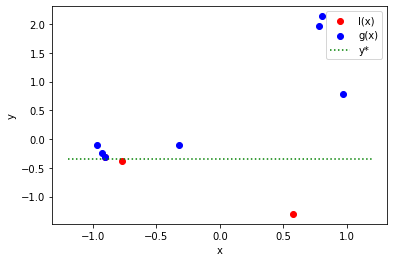
The resulting sampling points are divided into two parts, l(x) and g(x).
Tunny divides them into two parts by y*, which by default is the smaller of the
top 10% of individuals or 25 individuals.
In the following example, y*=-0.83, and the value is divided into l(x) and
g(x).
STEP3
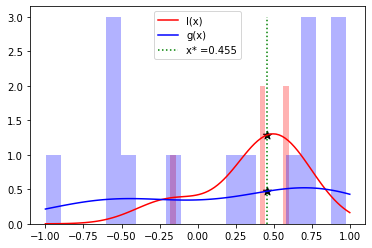
Next, kernel density estimator(KDE) is performed for each of l(x) and g(x).
You can think of the KDE as a histogram of values expressed as a smooth curve.
The bars in the following figure show the histograms of l(x) and g(x), and the
curves are the KDE results.
The l(x) estimated by the KDE can be thought of as the probability of x obtained by the top individual (i.e., the individual with the smaller value) and g(x) as the probability of x obtained by the bottom individual (i.e., the individual with the larger value).
In TPE, the next search point is determined by finding the x where the ratio of l(x) to g(x), l(x)/g(x), is maximum. In this example, it is the point where x=0.455.
This means that from the above explanation, TPE calculates the point at which the probability of acquiring an individual with a smaller value is high and the probability of acquiring an individual with a larger value is small.
KDE is also known as Parzen Estimator, which is where the "PE" part of TPE comes from.
Notes
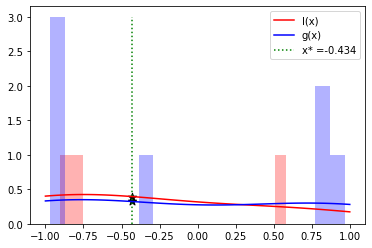
STEP 1 is doing random sampling, and this step is very important. Tunny samples 10 points by default, but always consider whether this number is appropriate for your optimization problem. In addition, the TPE paper recommends the following numbers
“number of variables” *11 - 1Without enough sampling, KDE will not be properly executed and will not be able to successfully find the next search point. As an example, here are the results when only half the number of samples performed above were taken.
Because it is not sufficiently sampled, the next search point is calculated to
be x=-0.434, which is completely different from the value near x=0.5, where
the global minimum exists.