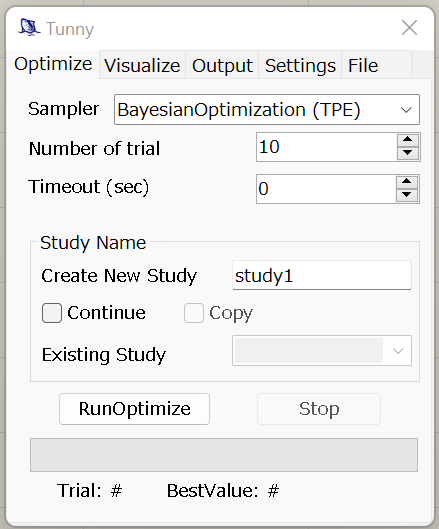
Optimize Tab
Values that can be set and their meanings are as follows.
Sampler
- Sets the algorithm to perform the optimization. The following types are available.
- All are provided by Optuna.
- Bayesian optimization(TPE)
- Bayesian optimization(GP)
- Genetic algorithm(NSGA-II)
- Evolution strategy(CMA-ES)
- Quasi-MonteCarlo
- Random
- Grid
Number of trial
- This number of trials will be performed.
- If the grid sampler is selected, the calculation is performed by dividing each
entered Variable by this number.
- Note that the number of calculations is (Number of trial) to the power of (Number of Variable).
Timeout(sec)
- After the time set here elapses, optimization stops.
- If 0 is input, no stop by time is performed.
Study Name Group (new in v0.6)
- When starting a new optimization, enter the name of the optimization in "Create New Study" and uncheck the other checkboxes.
- To continue an existing optimization, check the "Continue" checkbox and select the study you wish to continue from "Existing Study".
- You can also copy an existing optimization result and continue resuming it
under a different StudyName.
- Check the "Continue" and "Copy" checkboxes, select the study you wish to copy from "Existing Study" and enter the name of the copied study in the "Create New Study" field.
- This is useful, for example, if you want to run TPE and GP, with the same initial sampling results, respectively.
Run & Stop
- RunOptimize
- Push the button to perform the optimization.
- If the StudyName you set already exists in the results file, the optimization is performed as a continuation of that result.
- Stop
- Force optimization to stop.
- Even when stopped, the system automatically saves the results up to the most recent evaluation.
Realtime Result (new in v0.6)
- The number of the currently running trial and the optimization status are displayed at the bottom of the progress bar in real time as the optimization runs.
- The state indication of optimization depends on the number of objective
functions.
- For single objective optimization, the minimum value is displayed.
- In the case of multi-objective optimization, the ratio from one previous
step of Hypervolume calculated from the results of the first two objective
functions is displayed.
- If the Hypervolume Ratio frequently exceeds 1, it is not yet converged.